Terminal session replay and blame trails: the layer pair-debugging tools keep skipping
Shared tmux and SSH sessions solve the live-collaboration half of pair-debugging. They don't solve the question that comes after the incident — who ran what, in what order, with what output. Replay and blame are the layer that closes the loop, and they're surprisingly cheap to add.
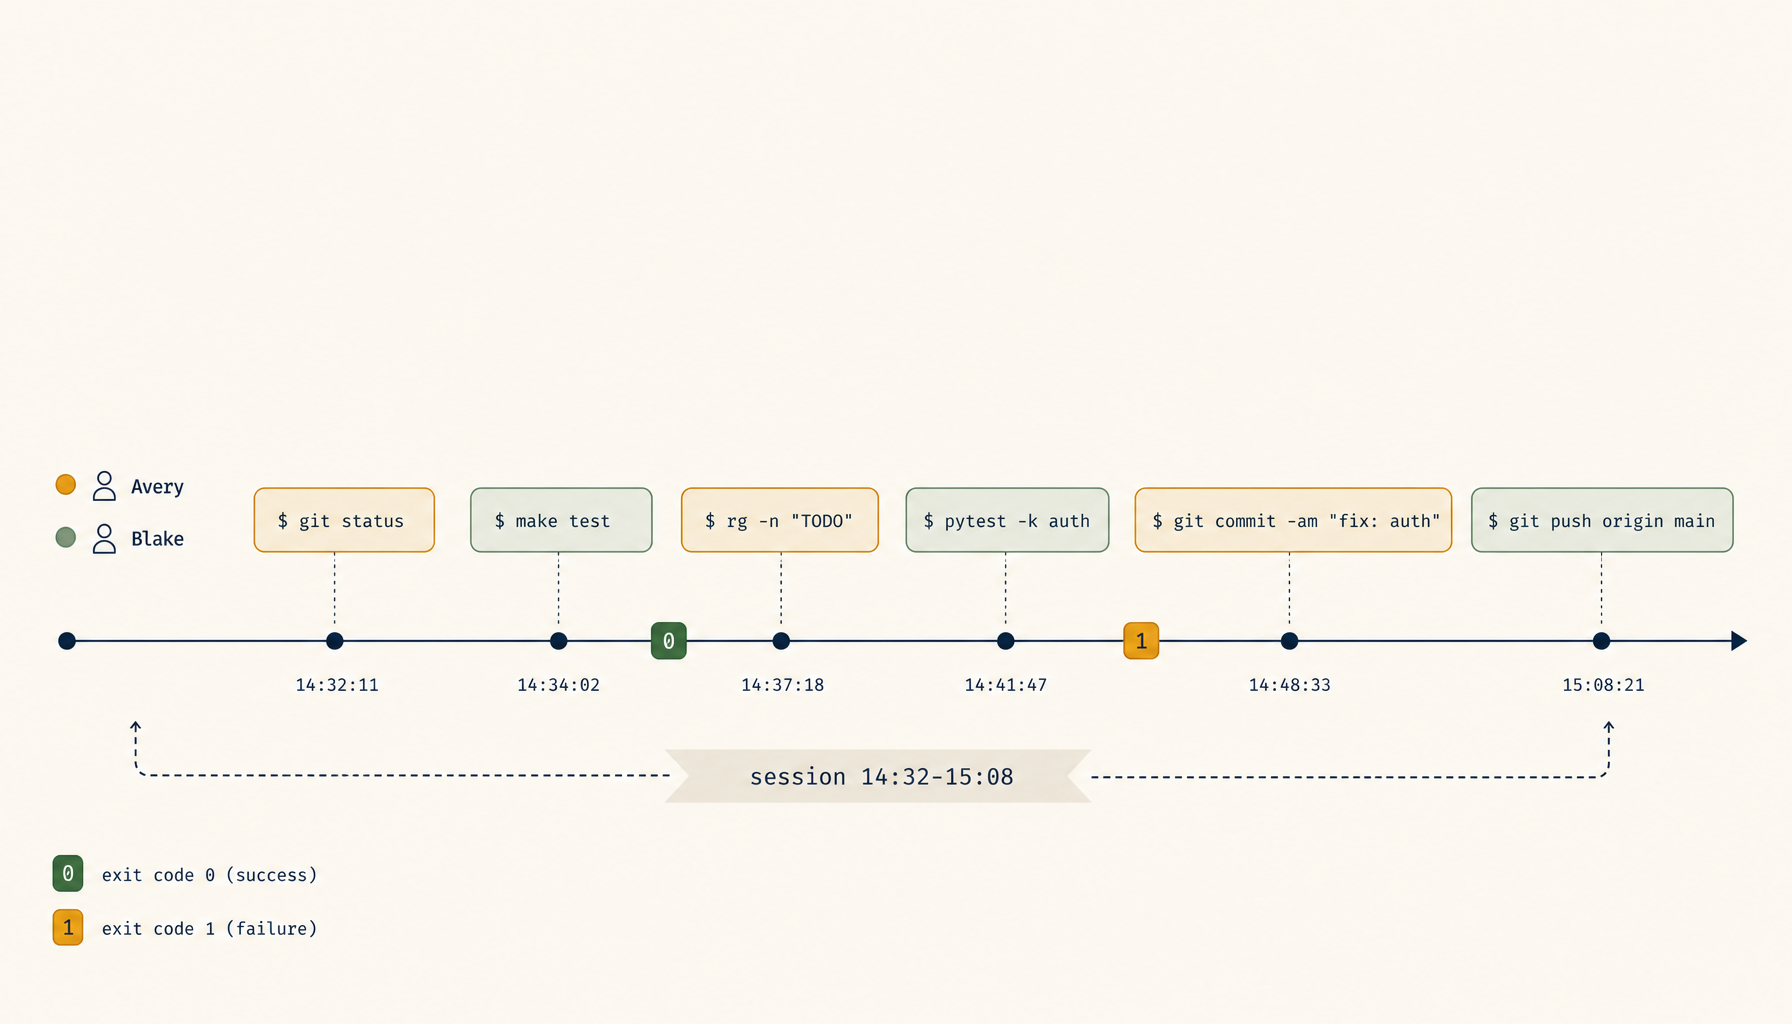
Two engineers debug a production issue together. They share a tmux session, swap who's driving every few minutes, and three hours later the issue is fixed. Then the postmortem author sits down and asks: which commands did we run, in what order, and what did the output show. The answer, far too often, is "I think I ran the kubectl logs and then Sam ran the migration script — or was it the other way?"
The live-collaboration half of pair-debugging has been solved for years. tmux + ssh, tmate, sshwifty, Cluster SSH, Warp's session sharing, VSCode's Live Share — pick your flavour, two people drive one terminal. What none of those tools ship by default is the half that comes after the live session ends: a faithful, replayable, attributable record of what happened. The complaint shows up across r/devops, r/sre, and the various pair-programming subs in the same shape — "we figured out the issue, but writing the postmortem is archaeology."
Replay and blame are the missing layer. They're not expensive to add. They're not even technically new — script(1) recorded terminal sessions on Unix decades ago. What's missing is the modern shape: per-keystroke attribution, time-ordered playback, structured export, and a UX that makes it usable during the incident review rather than only when forensic.
What pair-debugging tools already capture
Most shared-terminal tools capture something. The shapes vary:
- tmux + asciinema — records the terminal byte stream verbatim, replays it as a video. Faithful but anonymous: there's no record of which participant typed which character.
- tmate — provides a shared session over a relay; no built-in recording. You bolt on asciinema or
scriptif you want a log. - VSCode Live Share — session participants are named, but the focus is code edits, not terminal commands. Terminal sharing is a side feature with weak recording.
- Warp + similar modern terminals — capture command boundaries as structured entries, which is great for replay clarity, but only on one machine.
- Cloud-shell collab products — usually capture commands + output as structured blocks, sometimes with attribution. Closest to the target design, but tied to the vendor.
The through-line is that byte streams are easy to capture and attribution is not. tmux doesn't know which TCP connection a keystroke came from once it's in the tty. The fix has to live one layer above tmux — at the input router, before the bytes hit the shared pty.
The three primitives
A replay-and-blame layer worth adding has three primitives. None of them require changing tmux or your shell.
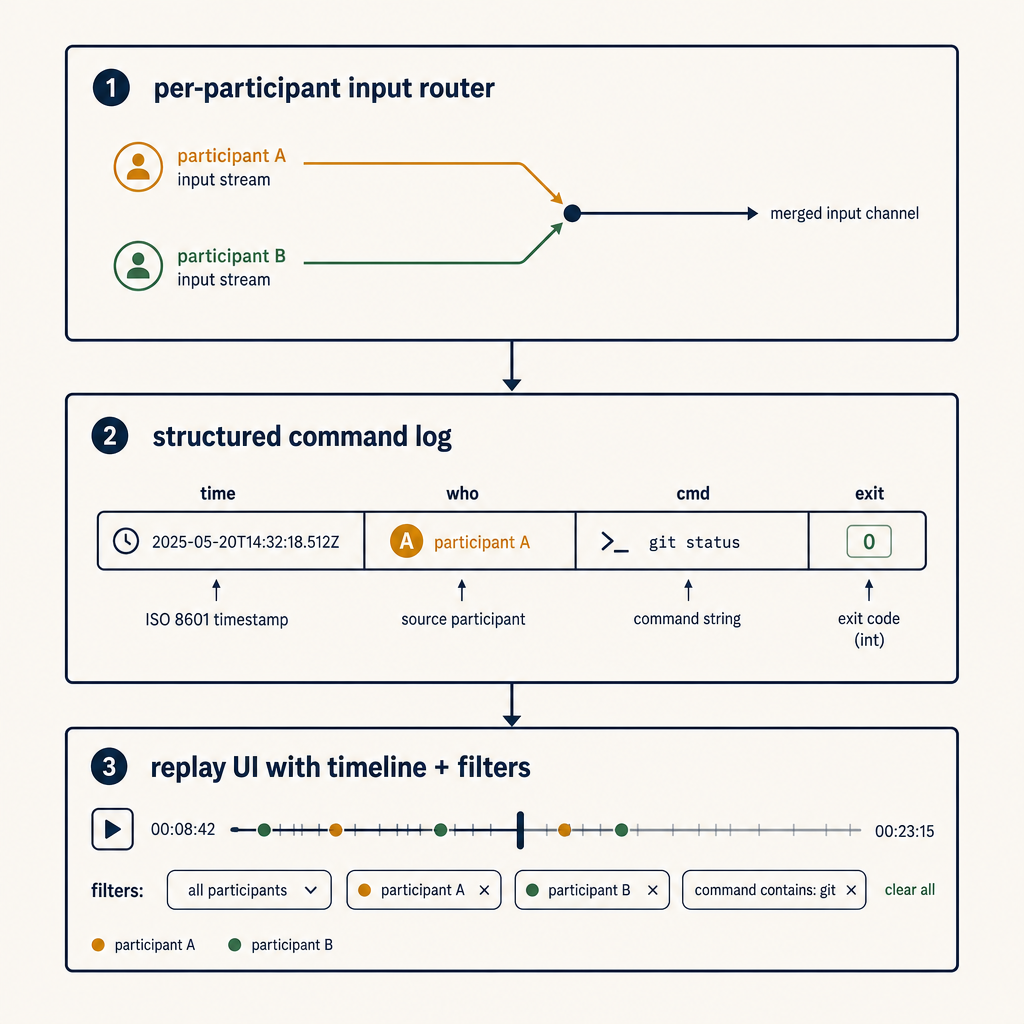
Primitive 1 — per-participant input router
The shared session has multiple participants; the OS sees one pty. The input router sits between participants and the pty and tags every keystroke (or every input line, which is enough for most use cases) with a participant identifier before forwarding to the pty.
Tagging once at this layer cascades through everything. The recorder downstream sees the tagged stream and can attribute every byte. The replay UI gets the same data and can render "Sam typed this, you typed that."
In an SSH-based architecture, the router is a small daemon between the SSH server and tmux. In a relay-based architecture (tmate-shaped), the router is the relay itself. Adding it once gives you blame everywhere.
Primitive 2 — structured command/output log
Byte streams are great for replay video; they're terrible for grep. The second primitive is a structured log that records, per command:
- timestamp (monotonic + wall-clock)
- participant identifier
- working directory + relevant env vars (
KUBE_CONFIG,AWS_PROFILE,DATABASE_URLredacted) - command line as executed
- exit code
- duration
- output (truncated to a cap; full output linked separately)
This is what the postmortem author actually queries. "Show me every command run against prod-west-2." "Show me everything Sam ran in the last 30 minutes." "What commands had non-zero exits." All of those answers fall out of a structured log; none of them are extractable from a byte stream without re-running OCR-style parsing.
The shell's PROMPT_COMMAND (bash) or precmd/preexec (zsh) hooks give you most of this for free. The router enriches it with participant attribution.
Primitive 3 — replay UI with timeline + filters
The replay UI does two jobs that asciinema alone doesn't:
- Timeline — show command-level events as a row each, with timestamps, participant, and exit code. Click a row, the byte-stream playback jumps to that point. The postmortem author works in the timeline view 90% of the time and dips into byte-stream playback for the 10% where they want to see exactly what was on screen.
- Filters — "only Sam's commands," "only non-zero exits," "only kubectl," "only the last 30 minutes before the rollback." Filters turn the log into an actual investigation tool.
The UI doesn't need to be fancy. A static HTML export at the end of the session is enough for most teams; a hosted dashboard is nice for orgs that run lots of these.
What this unlocks that the current tooling doesn't
Four postmortem-shaped questions stop being archaeology when replay-and-blame is in place:
- "What did we try before the rollback?" — exact command sequence, attributed, with exit codes. Answer in 30 seconds, not 30 minutes of "I think we ran...".
- "Who has been driving when the bad command ran?" — not for blame-the-human reasons; for understanding what context the driver had at the moment of decision. Often the driver was the person with less context, which is the real lesson.
- "Was there anything else weird around that time?" — filtering by time window across all attribute dimensions surfaces the second issue that was happening in parallel and got missed live.
- "Can we ship the playbook from this incident?" — the timeline view is already 80% of the runbook. Export, lightly edit, ship. Teams that do this regularly accumulate a playbook library that wouldn't otherwise get written.
None of these are luxury features. They're the deliverables a senior incident reviewer expects, and the tools that fail to produce them push the cost of producing them onto the engineer's memory of the session.
Privacy and red lines
Recording every command typed by every participant is a feature with sharp edges. Four rules keep the design defensible:
- Recording is opt-in per session, advertised in-band. The first thing the session displays is "recording is on, output is being captured." Anyone who joins later sees the same banner.
- Secrets are redacted at the log layer. Patterns for AWS keys, GCP service accounts, Stripe keys, password-shaped env vars are stripped before the log is written. The byte stream is harder to redact; for sessions touching prod, run with a higher redaction setting that also strips lines matching the patterns from the playback.
- Logs have an explicit retention policy and a destruction command. 30 days is a defensible default; longer requires a specific reason. "Forget this session" should be a single command, with confirmation.
- Participants can request a redaction. If someone typed a password by accident — and they will — a one-keystroke "redact the last 10 minutes from my input" makes the difference between a recoverable mistake and a security incident.
The tools that fail in production are the ones that don't think through these red lines until after the first breach. Putting them in the design from day one is cheap; bolting them on later isn't.
Where to start if you want this today
Three levels, depending on appetite:
- Level 1 —
script(1)+ a stamp. Every shared session starts withscript -t /tmp/session-$(date +%s).log. At the end, the timing file plus the typescript file gives you a poor-person's replay. No attribution, but better than nothing. Five minutes of setup; usable in one afternoon. - Level 2 — tmux + asciinema + a wrapper. A wrapper script starts asciinema rec, writes a session manifest with participant names (entered by the driver), and uploads the cast to an internal location at session end. Replay is a video, attribution is per-session not per-keystroke, structured log doesn't exist. Adequate for postmortem context; weak for filtered queries.
- Level 3 — a real router. A small daemon between SSH and the shared pty that tags input streams per participant, writes a structured command log with
preexec/precmdshell hooks, and emits a static HTML replay at session end. A few hundred lines, ~a day to build, mostly reused infrastructure (asciinema for byte stream, shell hooks for commands, a small static-site generator for the UI). The version that actually scales. 1devtool ships this layer as part of its shared-terminal product if you'd rather adopt than build.
For most teams, Level 2 is the right place to start — it captures enough to be useful in the next postmortem, and it teaches you which features you actually want before you build Level 3.
The deeper point is that pair-debugging is half a workflow without replay. The half that's been built is the part that's fun to use; the half that's been skipped is the part that pays off after the incident. Shipping it raises the durable value of every debugging session from "we fixed the thing" to "we fixed the thing and the team can learn from it next quarter." That's the layer worth adding.